14 min read
Building a Full-Stack ESP32 IoT Project for Smart Beehive Monitoring

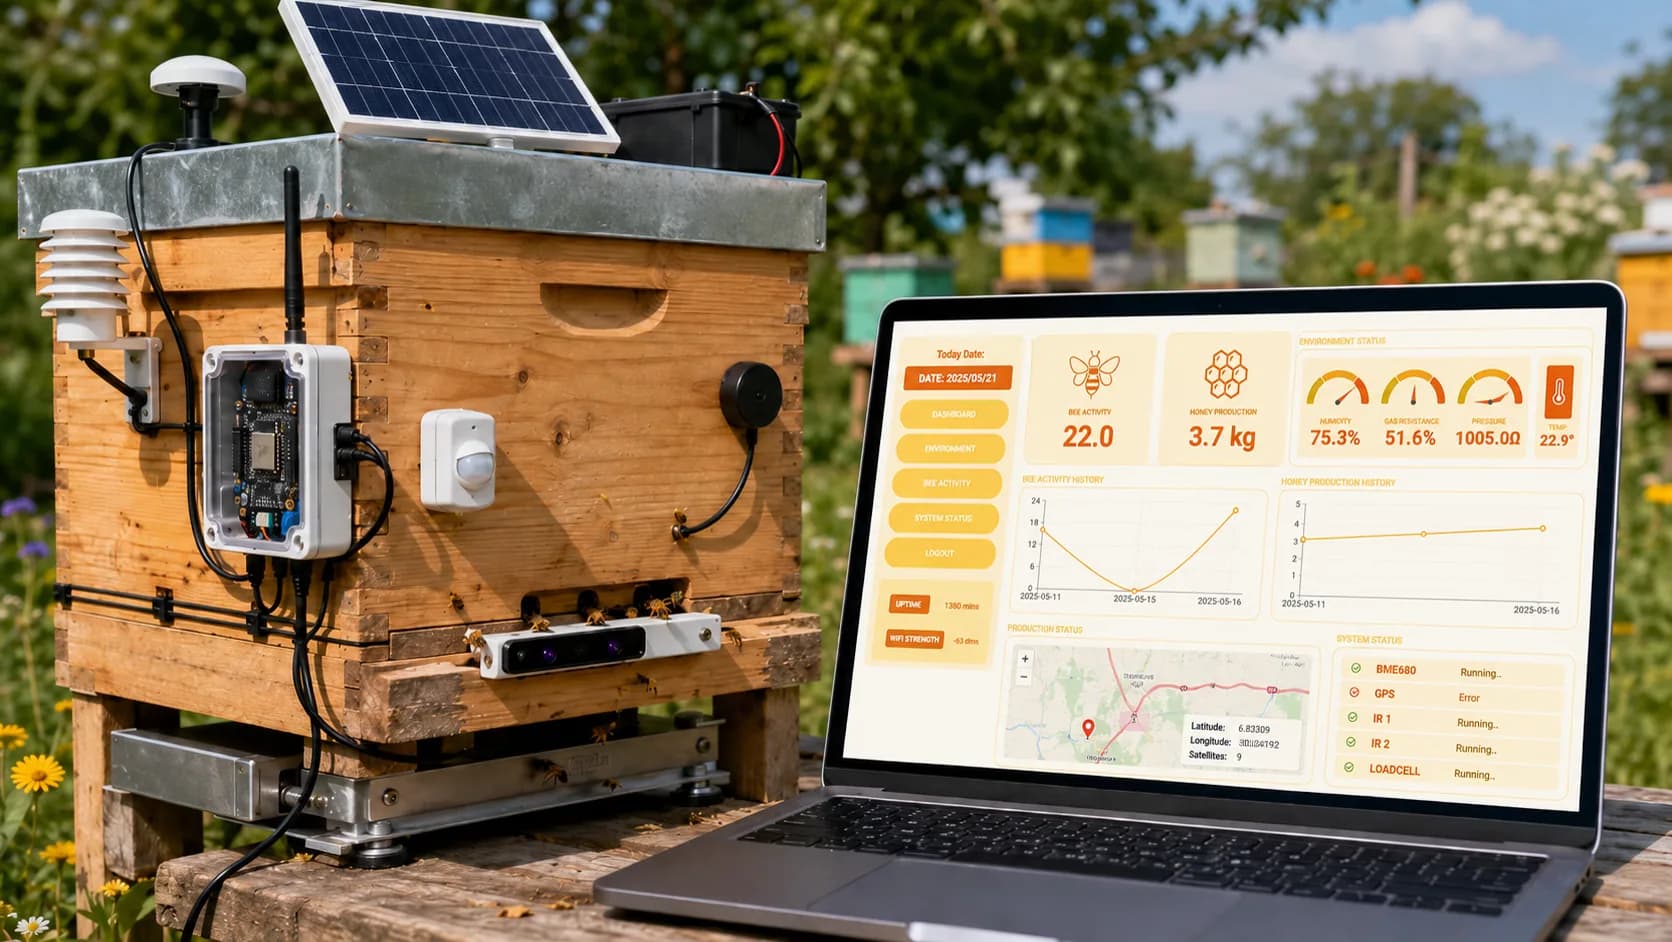
My dad’s apiary is not exactly a quiet place to test electronics.
There is heat, dust, insects, sunlight, humidity, and the constant low noise of a living hive doing what a hive does. It is also the kind of place where a “simple IoT project” stops being simple very quickly. A sensor reading that looks perfect on a desk can become useless outside. A wire that behaves nicely during testing can loosen. A dashboard that looks clean with mock data suddenly feels fragile when the data is coming from real hardware.
That was the reason I wanted to build this project properly.
The goal was simple in one sentence: build a complete live telemetry system from PCB to browser, where an ESP32 collects beehive data, sends it to Firebase Realtime Database, and a real-time monitoring dashboard turns that sensor data into something a beekeeper can actually understand.
TL;DR: this is a production-style ESP32 smart beehive monitoring case study: sensor firmware, Firebase live sync, React dashboard, solar power constraints, and the engineering decisions needed to make the system useful outside a desk demo.
Related portfolio page: Smart Beehive Monitor project. Related AI experiment: Azure Custom Vision beehive mite detector.
I split the project into two public repositories, but I do not think of them as two separate projects:
- Hardware / edge layer: https://github.com/deaneeth/smart-beehive-monitor
- Dashboard / cloud layer: https://github.com/deaneeth/Smart-Beehive-Dashboard
Together, they form one full-stack IoT system: sensors in the hive, embedded C++ firmware on the ESP32, Firebase as the live data backbone, and a React TypeScript dashboard for visualization.
The Problem: What “Smart Beehive” Actually Means#
When people hear “smart beehive,” it can sound like a fun sensor demo. Put a temperature sensor inside a box, send the number somewhere, make a chart, call it smart farming.
That is not enough.
A beehive is a biological system, not a static machine. If the temperature changes, it may say something about colony stress. If humidity rises, it may affect hive conditions. If weight changes over time, it can hint at honey production, feeding patterns, or loss. If bee traffic drops suddenly, that can be a signal worth investigating. If motion is detected near the hive at night, the beekeeper may want to know.
So for this ESP32 IoT project, I wanted to monitor several signals at once:
- Temperature, humidity, pressure, and air quality using the BME680
- Bee entrance and exit activity using TCRT5000 IR sensor arrays
- Hive weight using an HX711 load cell setup with a 100kg load cell
- Predator or movement detection using an HC-SR501 PIR motion sensor
- GPS location using a NEO-6M module for anti-theft and tracking
- Solar and battery power status for outdoor reliability
This is also where I noticed that most tutorials fell short for what I wanted.
A tutorial might show how to connect one BME sensor to an ESP32. Another might show Firebase writes. Another might show a chart in React. But the hard part is not one sensor, one API call, or one graph.
The hard part is making the whole thing behave like a living IoT monitoring system.
The Architecture: From Hive to Dashboard#
Here is the architecture in plain English.
1Beehive2↓3Sensors: BME680, TCRT5000, HX711 + load cell, PIR, GPS, battery/solar signals4↓5ESP32 running embedded C++ firmware with PlatformIO6↓7WiFi connection8↓9Firebase Realtime Database10↓11Next.js + React + TypeScript dashboard12↓13Gauges, charts, alerts, GPS map, and historical trends
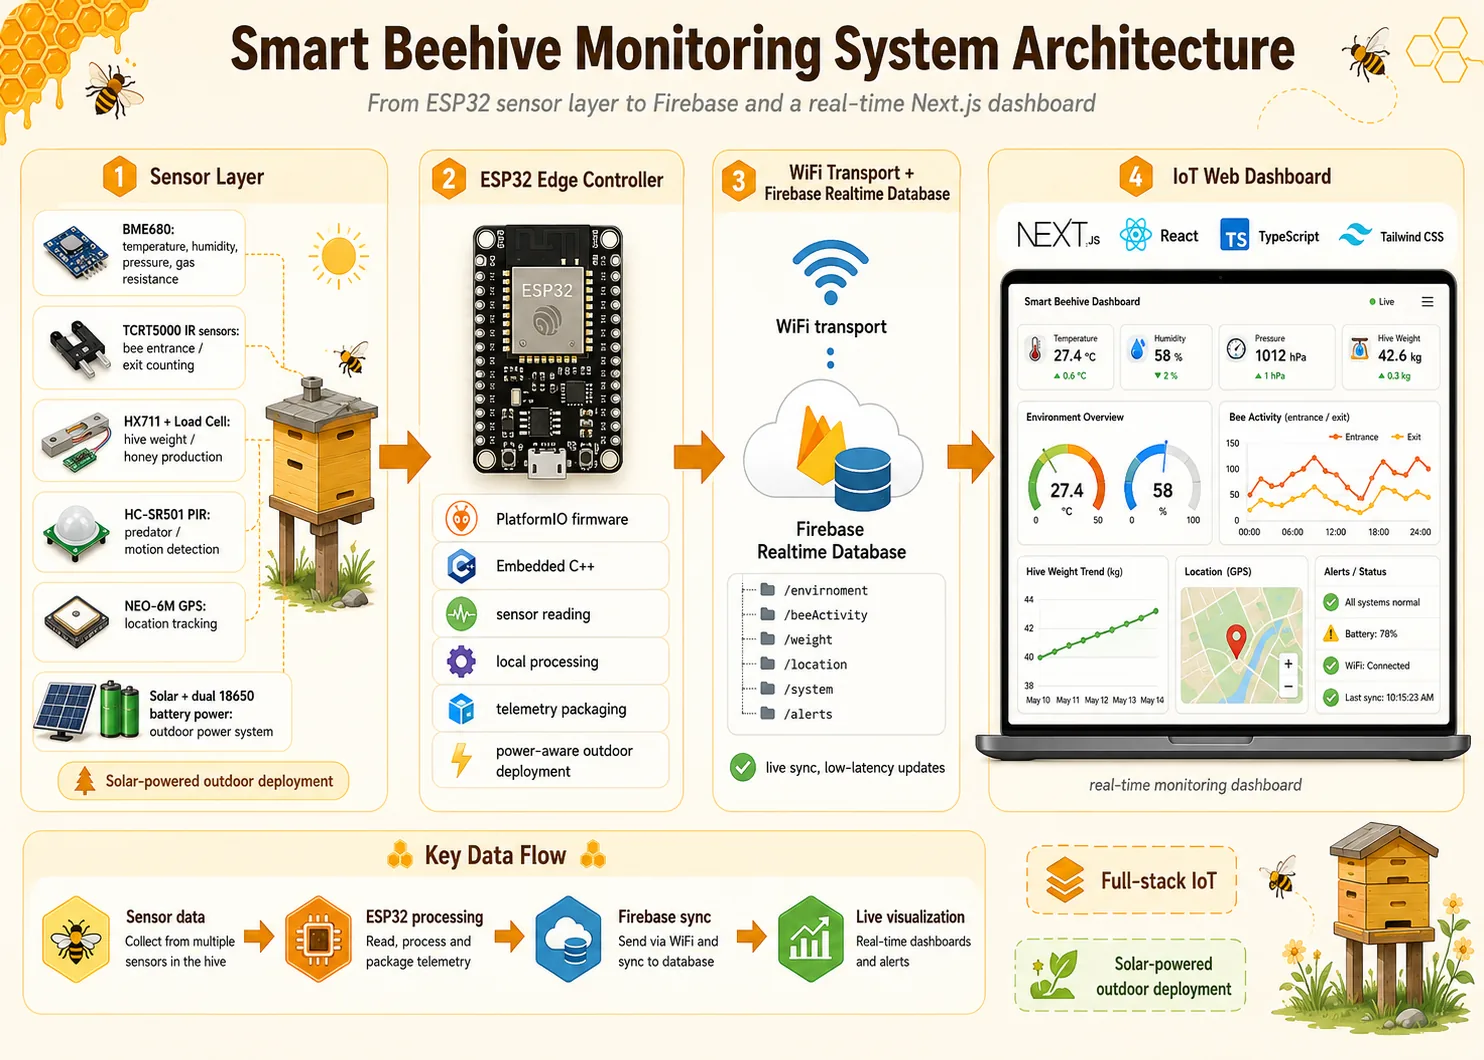
The edge layer is responsible for collecting data from the physical world. The ESP32 reads the sensors, prepares structured telemetry, and syncs it to Firebase.
The transport layer is WiFi. I chose WiFi because this version was designed around accessible hardware and a Firebase-first architecture. A GSM or LoRa version would be useful for remote farms, but for this build, WiFi kept the system easier to develop, debug, and connect to a real-time dashboard.
The cloud layer is Firebase Realtime Database. Instead of building my own backend first, I wanted a live data backbone that could support real-time sync without writing a custom WebSocket server.
The frontend is the IoT web dashboard. It consumes the Firebase data and turns it into visual feedback: gauge charts, time-series charts, activity summaries, alert states, GPS location, and power status.
That distinction matters. This is not a simulation where the frontend is the main project and the hardware is imaginary. The dashboard exists because the hardware produces data. The hardware exists because the dashboard needs meaningful real-world inputs.
That is the part I care about as an AI/ML and software engineer: end-to-end systems thinking.
Building the Edge: ESP32 Project, Sensors, and Embedded Systems Decisions#
For the hardware layer, I used an ESP32-based firmware project written in embedded C++ with PlatformIO.
The ESP32 made sense because it gives a good balance of cost, WiFi, available GPIO, community support, and low-power possibilities. A Raspberry Pi would have been easier for some high-level scripting tasks, but it would also be heavier, more power-hungry, and honestly unnecessary for this type of sensor data collection.
For a solar-powered IoT device, the microcontroller choice matters.
The project uses:
- ESP32-WROOM-32U development board
- BME680 environmental sensor
- TCRT5000 IR sensor arrays
- HX711 amplifier with 100kg load cell
- HC-SR501 PIR motion detector
- NEO-6M GPS module
- Dual 18650 3.7V batteries
- 5W solar panel
- TP4056 charging module
- MT3608 boost converter
Each sensor has a reason.
The BME680 gives environmental monitoring. Temperature and humidity are obvious for beekeeping, but gas resistance also gives an air-quality-related signal that can be useful as part of broader environmental monitoring.
The TCRT5000 sensors are for bee movement. Counting bees perfectly is harder than it sounds because bees do not politely walk through sensors one at a time like test objects in a lab. But entrance activity is still useful as an approximate activity signal, especially when tracked over time.
The HX711 and load cell setup is for hive weight. Weight trends are important because honey production and hive health are not just instant values. They are patterns.
The PIR sensor adds a simple predator alert or motion detection layer. The GPS module gives location awareness for anti-theft or field tracking.
This is what I mean by practical sensor fusion. Not a fancy deep learning model. Not pretending this is computer vision. Just multiple imperfect signals combined into a more useful picture of the hive.
Why Firebase on constrained hardware?#
Writing to Firebase directly from the ESP32 was a tradeoff.
The good part: fewer backend moving pieces. The ESP32 can push current values and history records into Firebase, and the dashboard can subscribe to updates.
The harder part: embedded Firebase libraries change, and constrained hardware is not as forgiving as a laptop. One of the practical issues I had to handle was library migration. The project documentation now makes it clear that it uses mobizt/FirebaseClient, the newer async library, and not the older deprecated Firebase ESP Client library.
That kind of detail is not glamorous, but it matters. A project can look broken because of one incompatible library version.
1; platformio.ini idea2lib_deps =3mobizt/FirebaseClient4mobizt/FirebaseJson
For embedded systems, documentation is not decoration. It is part of the build.
Designing the Backbone: Firebase Realtime Database#
I used Firebase Realtime Database because the dashboard needed live updates.
A REST polling approach would work, but it would add unnecessary delay and repeated requests. For a real-time dashboard, I wanted the frontend to react when the data changes, not ask every few seconds, “Anything new yet?”
The database structure is organized around the major system domains:
1smart-beehive/2├─ environment/3│ ├─ current/4│ └─ history/5├─ beeActivity/6├─ weight/7├─ location/8├─ system/9│ ├─ power/10│ └─ status/11└─ alerts/
That structure seems simple, but it forced me to think carefully about data shape.
The dashboard does not want random sensor dumps. It wants predictable paths:
environment/currentfor latest temperature, humidity, pressure, and gas resistancebeeActivity/currentand daily history for movement patternsweight/currentandweight/historyfor load cell readingslocation/currentfor GPS coordinatessystem/power/currentfor voltage, percentage, and charging statealerts/currentfor motion, low battery, and sensor error states
The biggest design rule I followed was this: current state and historical state should not fight each other.
A dashboard card needs the latest value quickly. A chart needs history. Those are related, but not the same access pattern. Keeping both paths makes the frontend easier to reason about.
For security rules, the project documentation keeps it practical: public dashboards may allow reads, but writes should be restricted. That is a basic but important production-style decision. The device should write telemetry. The dashboard should mostly read. Not every client should be able to overwrite the hive.
Building the Dashboard: React, TypeScript, Tailwind, and the IoT Web Dashboard#
For the frontend, I built a React TypeScript dashboard using Next.js, Firebase Realtime Database, Recharts, React Gauge Charts, Leaflet, and Tailwind CSS.
I specifically did not use Python or Streamlit for this layer.
Streamlit is excellent for quick data apps and ML demos, but this project needed to feel like an IoT web dashboard that could sit in a portfolio and be extended like a real web application. I wanted routing, reusable components, typed data interfaces, responsive UI, and frontend architecture.
The dashboard includes:
- Live metric cards for environmental values
- Gauge charts for quick status reading
- Historical trend charts using Recharts
- Bee activity visualization
- Hive weight tracking
- GPS map view using Leaflet
- Predator alert display
- Solar and battery power monitoring
- Responsive UI styling with Tailwind CSS
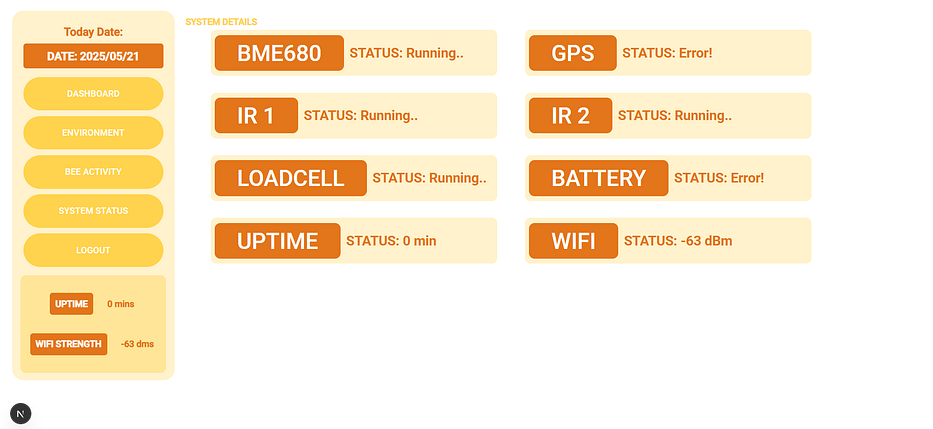
TypeScript helped a lot here because IoT data can get messy. A value might be missing. A timestamp might not match the format expected by a chart. A Firebase path might return null during first load.
Typing the expected data shape makes those problems more visible.
A simplified version of the dashboard setup looks like this:
1git clone https://github.com/deaneeth/Smart-Beehive-Dashboard2cd Smart-Beehive-Dashboard npm install3cp .env.example .env.local4npm run dev
And the hardware side starts like this:
1git clone https://github.com/deaneeth/smart-beehive-monitor2cd smart-beehive-monitor3platformio run4platformio run --target upload
The dashboard repository does not currently publish a production deployment URL, so I am not going to pretend there is one.
Right now, the important part is that the frontend proves the cloud layer is usable, readable, and connected to the hardware design.
The Hard Parts: What I Actually Struggled With#
This was not a clean “I connected sensors and everything worked” project.
The first hard part was dependency drift. In normal web development, a dependency issue is annoying. In embedded development, it can feel like the board is gas-lighting you. The Firebase library migration was one of those moments. The fix was not just changing a line of code. It required documenting which library version the project expects and making the setup reproducible.
The second hard part was outdoor power management. A solar-powered IoT project sounds elegant, but batteries, charging modules, voltage boosting, and real sunlight conditions are not theoretical. The hardware design uses dual 18650 batteries, a 5W solar panel, TP4056 charging, and MT3608 boost conversion, but real field deployment still needs careful testing over time.
The third hard part was calibration. A 100kg load cell is only useful if the readings are calibrated. Bee counting with IR sensors is also approximate because real bees move unpredictably. This is where engineering humility helps. The goal is not to claim perfect measurement. The goal is to build a system that can be calibrated, improved, and validated.
The fourth hard part was frontend-backend data mismatch. Embedded firmware thinks in sensor readings. Frontend dashboards think in UI state. Firebase sits in the middle. If the data paths are inconsistent, the dashboard becomes fragile. That is why the database structure became a core part of the architecture, not an afterthought.
In other words, the hardest part was not any single technology. It was making all the parts agree with each other.
What I Built: Stats and Outcomes#
The project is public and split into two repositories.
Hardware / Edge Repository#
Repository: https://github.com/deaneeth/smart-beehive-monitor
At the time of writing:
- Stars: 16
- Commits: 31
- License: MIT
- Main language: C++
- Stack: ESP32, PlatformIO, embedded C++, Firebase Realtime Database
- Documentation: wiring guide, bill of materials, Firebase setup, dashboard setup, and system setup
This repository contains the firmware and hardware-side documentation for the ESP32 IoT project.
Dashboard / Cloud Repository#
Repository: https://github.com/deaneeth/Smart-Beehive-Dashboard
At the time of writing:
- Stars: 4
- Commits: 13
- License: MIT
- Languages: TypeScript, CSS, JavaScript
- Stack: React, Next.js, TypeScript, Firebase Realtime Database, Recharts, React Gauge Charts, Leaflet, Tailwind CSS
This companion dashboard proves the project is not only an IoT hardware project. It is a full-stack IoT system with a real web interface.
What works today#
The architecture, firmware structure, Firebase schema, setup documentation, and dashboard implementation are in place. The project demonstrates embedded systems work, real-time data sync, cloud-backed telemetry, and frontend visualization.
What still needs field testing#
I still want to test the system longer in outdoor hive conditions. The main areas that need real field validation are sensor calibration, long-term solar charging behavior, enclosure durability, IR bee counting accuracy, and reliability over multiple days of continuous operation.
That is the honest state of the project. It is functional as an engineering build and strong as a production-style prototype, but field reliability is something that has to be earned outside, not claimed in a README.
Key Takeaways#
- Design the data model before the dashboard becomes complicated.
In an IoT monitoring system, the database structure is part of the product. Separate current state from historical data early, because dashboards, alerts, and charts do not all read data the same way. - Choose hardware based on deployment constraints, not hype.
I used ESP32 instead of Raspberry Pi because this system needed low-power sensor collection, WiFi, and outdoor solar-powered IoT behavior. The best board is not the most powerful one. It is the one that fits the environment. - Build the complete loop, even if each part starts simple.
A sensor reading alone is not a system. A dashboard with mock data is not a system either. The value comes from closing the loop: physical sensor data, embedded firmware, cloud sync, real-time visualization, and feedback that a user can act on.
What’s Next#
I do not want to turn this into a fake startup road-map. The realistic next steps are more practical.
First, I want to improve field testing. That means running the hardware outside for longer periods and logging how the battery, solar charging, WiFi connection, and sensors behave in real conditions.
Second, I want to improve calibration workflows. The HX711 load cell calibration should be easier to repeat. The TCRT5000 bee counter logic can also be improved with better filtering and threshold tuning.
Third, I want to make the dashboard more useful for trend analysis. As an AI/ML engineer, this is where the project becomes interesting as a machine learning adjacent IoT project. Before adding models, I need clean historical data. Later, that data could support anomaly detection, predictive maintenance IoT patterns, or simple alerts for unusual activity.
Fourth, I want to improve deployment documentation so another IoT builder or beekeeper can reproduce the system without guessing.
No fake AI claims. No imaginary computer vision. Just better data, better reliability, and better engineering.
Closing#
This project reminded me why I like building complete systems.
Tutorial clones are useful for learning, but they usually end right before the engineering gets interesting. Real projects have mismatched libraries, unstable readings, imperfect sensors, awkward data shapes, power constraints, and UI decisions that reveal whether the backend was designed properly.
That is the work I enjoy.
Feedback is welcome from embedded engineers, React developers, beekeepers, smart farming builders, and anyone who has fought with sensors long enough to know that “it worked on my desk” is not the same as “it works outside.”
The repositories are open for contributions:
- https://github.com/deaneeth/smart-beehive-monitor
- https://github.com/deaneeth/Smart-Beehive-Dashboard
Thanks for reading.