RepoViz
LiveOverview
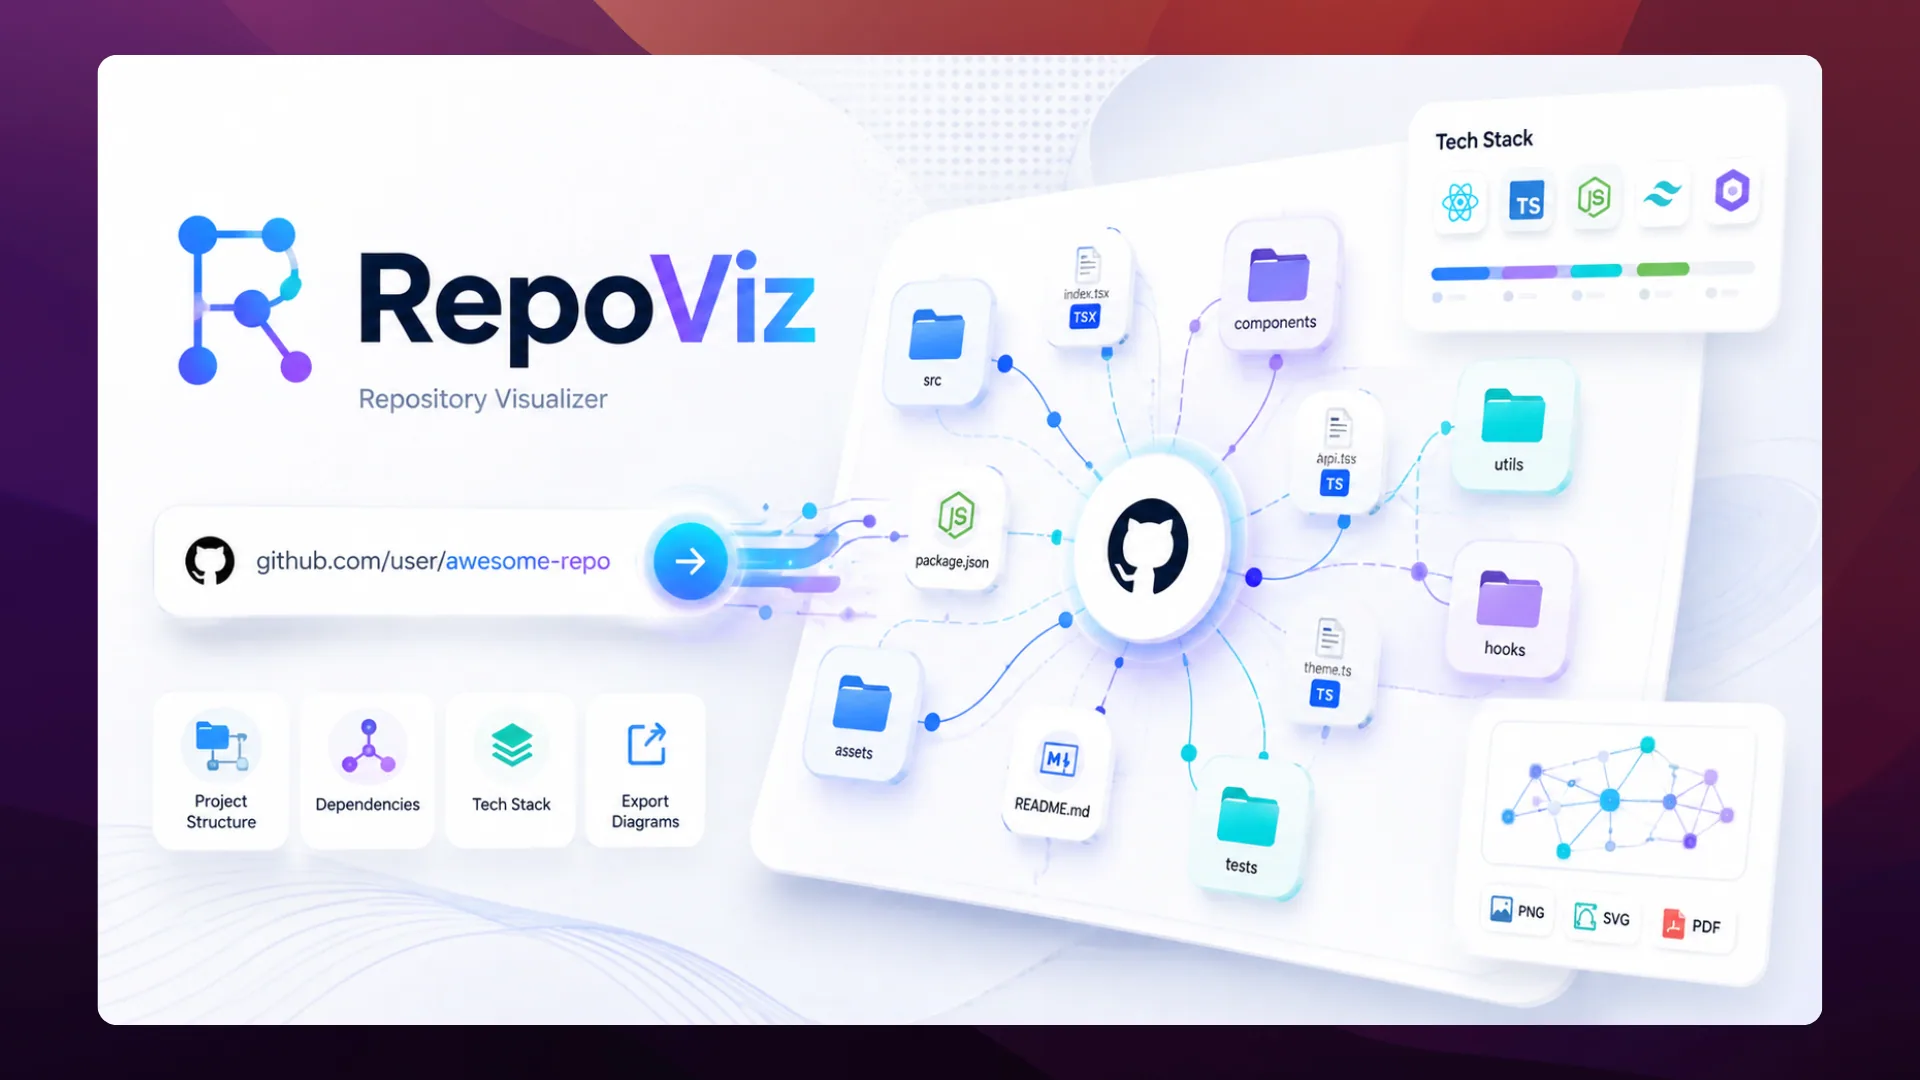
RepoViz is an AI-assisted developer tool for visualizing a public GitHub repository as an interactive graph. The app accepts a repository URL, asks Gemini 2.5 Flash to return structured JSON, then converts that data into D3 nodes and links representing the repo root, folders, files, languages, and dependencies.
The product is built with React 19, TypeScript, Vite, D3, and @google/genai. The useful part is the workflow: AI turns an unknown repo into a typed graph model, D3 renders it with zoom and drag interactions, and the sidebar gives users practical controls for file visibility, dependency filtering, layout mode, node colors, and link styling.
Architecture
Challenges & Solutions
AI output has to be machine-usable, not just descriptive
The Gemini call uses a response schema so the app receives predictable RepoData with language, dependency, and file-tree fields.
Repository graphs get cluttered quickly
The service limits the generated tree depth and the UI adds visibility controls for file nodes and dependency groups.
A static graph is not enough for inspection
The D3 view supports zooming, dragging, tooltips, layout switching, custom colors, and custom link styling.
AI-generated repository maps
Input
Repo URL
Users enter a public GitHub repository URL for AI analysis.
Analysis
JSON schema
Gemini returns structured repo metadata, dependencies, languages, and file tree nodes.
Visualization
D3 graph
D3 renders draggable, zoomable nodes with force, radial, and hierarchical layouts.
Features
- Gemini 2.5 Flash repository analysis through @google/genai
- Structured JSON schema for repo name, description, language usage, dependencies, and file tree
- D3 force-directed graph with draggable nodes, zoom, links, labels, and tooltips
- Node categories for repository root, folders, files, languages, and dependencies
- Sidebar visibility controls for file tree nodes and dependency groups
- Layout switching between force-directed, radial, and hierarchical views
- Customizable node colors and link styling