AQI Monitoring System
LiveOverview
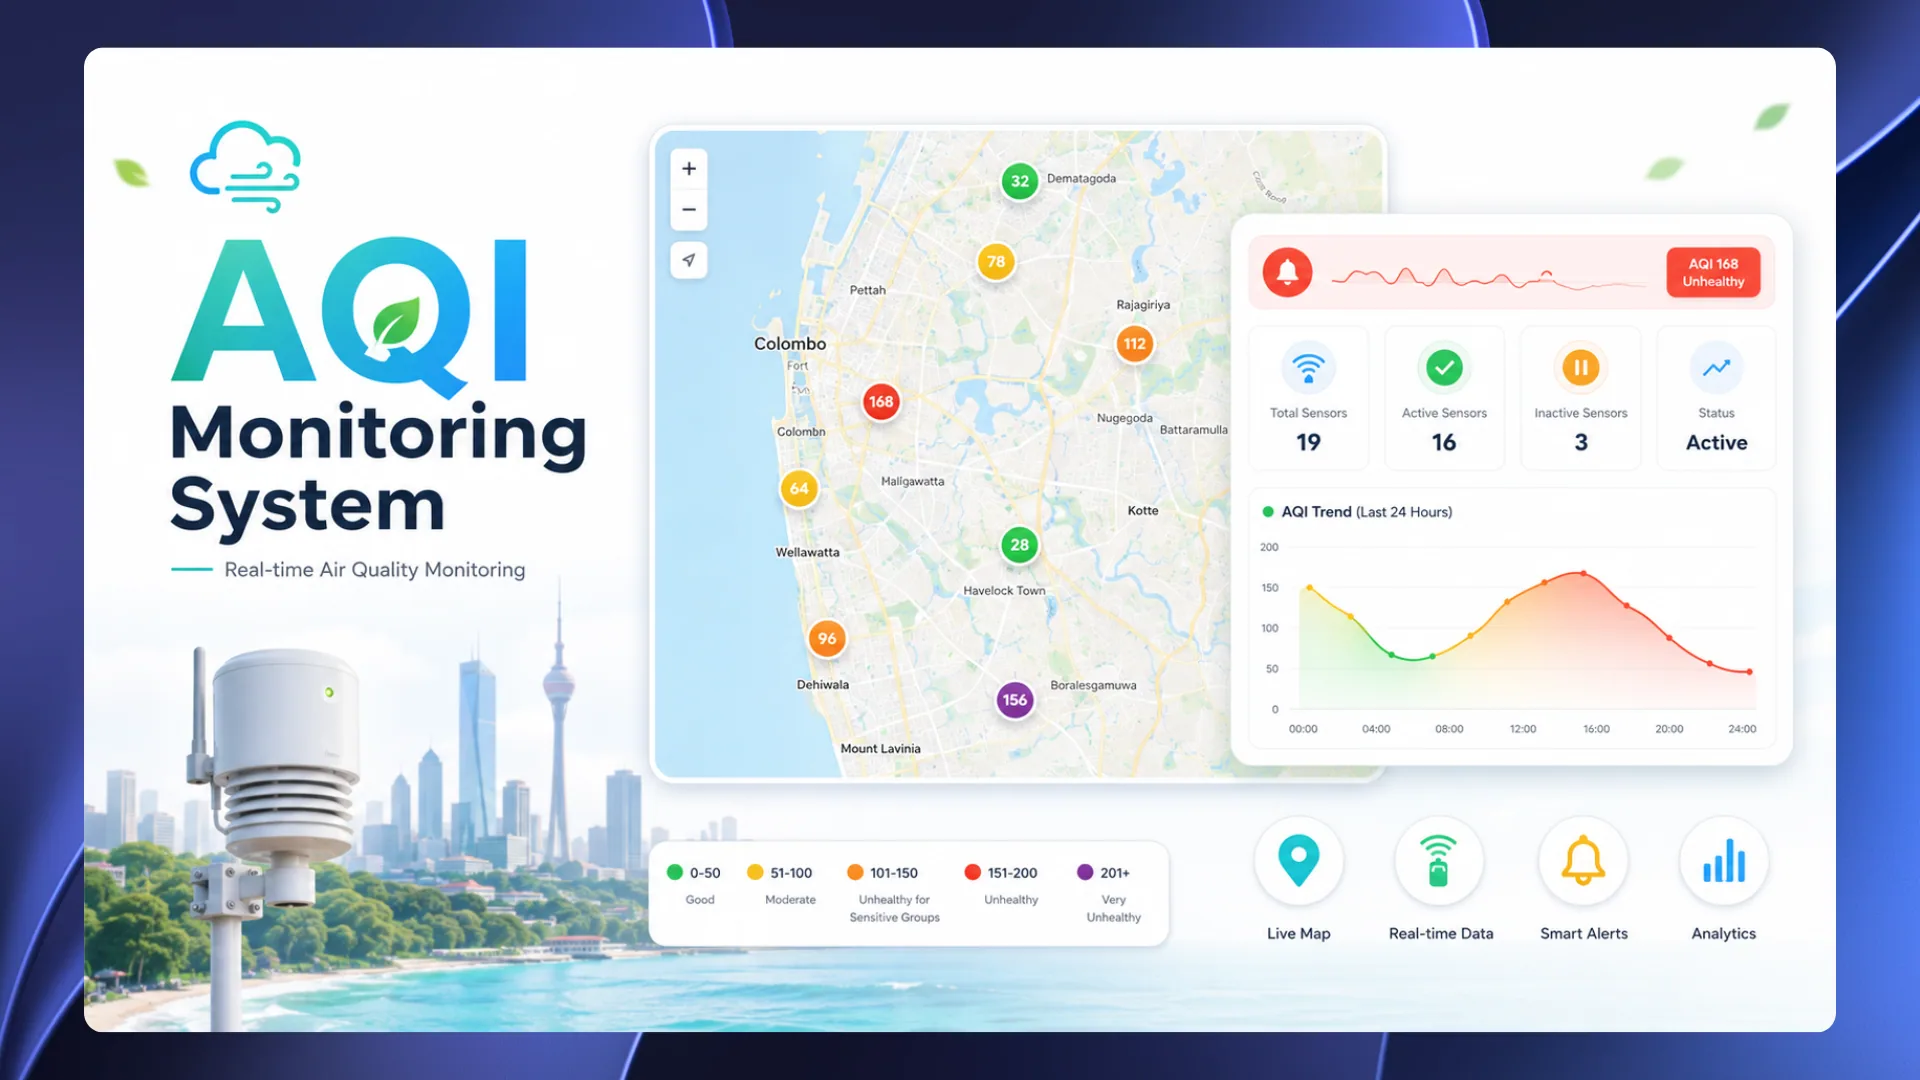
AQI Monitoring System is a Laravel and MySQL web application for visualising air-quality conditions across the Colombo Metropolitan Area. It combines a public Leaflet.js map, admin dashboards, simulated AQI data generation, alerting, CSV import, and role-based access control into one monitoring workflow.
The public side focuses on clarity: users can open the map, inspect colour-coded sensor markers, view detailed AQI readings, and understand the severity band immediately. The admin side adds the operational layer: sensor management, user management, alert configuration, CSV imports, diagnostics, and historical AQI charts.
The system uses simulated AQI data for demonstration rather than live hardware. That was a deliberate academic constraint, so the simulation engine supports realistic patterns such as random fluctuations, sine-wave behaviour, peak-hour variation, configurable intervals, and AQI value ranges. Alerts are generated when AQI values exceed 200.
The implementation is grounded in standard Laravel practices: PHP backend, MySQL schema for sensors, sensor data, users, and alerts, middleware-protected authentication, CSRF protection, REST-style JSON endpoints, Bootstrap-responsive Blade views, and PHPUnit unit/feature testing.
Architecture
Challenges & Solutions
The project needed to demonstrate real-time AQI monitoring without depending on physical air-quality hardware.
Built a simulation engine that generates AQI readings on a configurable interval using random fluctuation, sine-wave patterns, and peak-hour variations.
A public environmental dashboard and an admin operations system have very different permission needs.
Separated access into public users, monitoring admins, and system admins with Laravel authentication, middleware protection, CSRF protection, and role-specific dashboards.
Raw AQI numbers are hard to interpret quickly during monitoring workflows.
Used Leaflet.js markers coloured by standard AQI bands, with marker drill-downs, historical charts, and automatic alerts for readings above the unhealthy threshold.
Sensor data management can become manual and error-prone when multiple locations need updates.
Added sensor CRUD, deactivation, CSV import, and diagnostics tooling so admins can manage the monitoring network from the dashboard.
System Scope
User Roles
3
Public, Monitoring Admin, System Admin
Update Cadence
5 min
Default simulated AQI generation interval
Alert Trigger
>200
Very Unhealthy AQI threshold
AQI Bands
6
Good through Hazardous map categories
Features
- Public Leaflet.js map with color-coded AQI markers for Colombo-area sensor locations
- Real-time AQI visualization with automatic simulated updates every 5 minutes
- Simulation engine with random fluctuation, sine-wave patterns, and peak-hour variation
- AQI alert generation when readings exceed unhealthy thresholds above 200
- Three-role access model: public users, monitoring admins, and system admins
- Laravel authentication, middleware-protected admin routes, session handling, and CSRF protection
- Sensor management for creating, editing, and deactivating air-quality sensors
- CSV import for bulk sensor data upload
- System diagnostics dashboard for configuration and health visibility
- Historical AQI charting and detailed marker-level sensor information
- Configurable AQI generation intervals, value ranges, and alert thresholds
- PHPUnit unit and feature tests for core logic, endpoints, and database interactions
- Responsive Bootstrap interface tested across desktop, tablet, and mobile layouts